Introduction to online nature conservation databases. From data to knowledge product.

Related Content

 Rubber Boots Data
Data management – Rubber Boots Data
Posts about Data management written by Frank van der Most
In October last year, I blogged about the databases about nature conservation that I had started gathering. What I was discovering was overwhelming: the amount of topics, the amount of data per topic and the amount of databases that contain all that. Since then, I continued collecting and I reached over 50 databases and 30 database aggregators. The list is still growing and I am still occasionally bumping into yet another 400 pound gorilla in the room that I had not noticed before. Two such heavyweights are the UN's Biodiversity Lab and Microsoft's Planetary Computer. So, I am still drowning, but the outlines of the waters that I am drowning in, have become a lot clearer.
This post sketches those outlines, starting at the point where data is created, and moving towards the point where policy makers create policy.
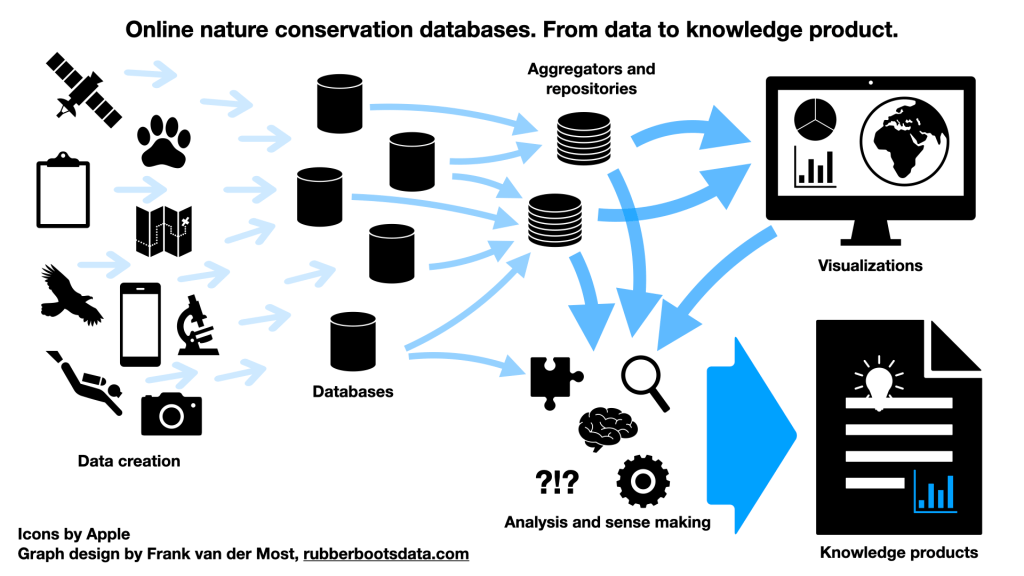
Data creators
So, countless people and countless machines create data about nature. The people typically are scientists and their assistants, government workers, researchers and their assistants at companies, hobbyists such as bird watchers and other amateur experts, and, nowadays, citizen scientists with a note pad, laptop or a phone. Those are, I don't know, but perhaps tens of millions of people worldwide. They use countless machines to create the data, and some of these machines create unimaginable amounts of data on a yearly basis. There are for example 1335 buoys of the US' National Oceanic and Atmospheric Administration and partners floating in the ocean ( and of course, there is a database driven map that keeps track of them ), and there dozens or perhaps hundreds of satellites observing earth's nature. One of them is called Sentinel 2, which creates images of the earth with pixels that represent as little as 10 by 10 meters. So, my mom's garden has two or three pixels dedicated to it.
The databases, repositories and aggregators
Those three pixels and all the other data has to go somewhere, and it goes into databases - you guessed it. Again, there are countless numbers of people involved in just that, getting the data into databases and managing it. Not as many as there are data creators, but still a lot.
The data collection has been going on for centuries, and the database work for decades. Because the world was not as connected as it is now, and even in spite of it being as connected as it is now, there have been and are a lot of databases being created about the same thing at around the same time but in different locations. About sea turtles for example. And yes, people have been trying to put those databases together in one place, so that humanity can have an overview of what goes on all over the world.
They do this with mixed success. Ideally speaking one would want to have data from all over the world structured and formatted in exactly the same way, so that it can be easily analyzed and compared. This is called aggregating and unfortunately, it is not always practically possible. The second best option is to at least have a database that lists where all the databases about topic x can be found. It is still a lot of work. These are called repositories.
In my list of databases, I do not yet make the distinction: both repositories and aggregators are called aggregators. Also, once I found a repository or aggregator, I stopped collecting the individual databases that they aggregate or list. So, my list is a bit of a mixed cocktail. Better start with the aggregators.
Visualizers for exploration
So far, this has been about data: stuff that goes into files and tables. And as has become clear by now, no one person can even start reading them. The level of detail and the amount of data is simply too big. Nature conservation is a big data area. So one needs a way to literally see the data, or at least some abstraction of it. As with all of the above, this is not specific to nature conservation. In other areas of life and the world, similar things are going on, and the past decade has seen not only the rise of big data but also of the means to visualize data.
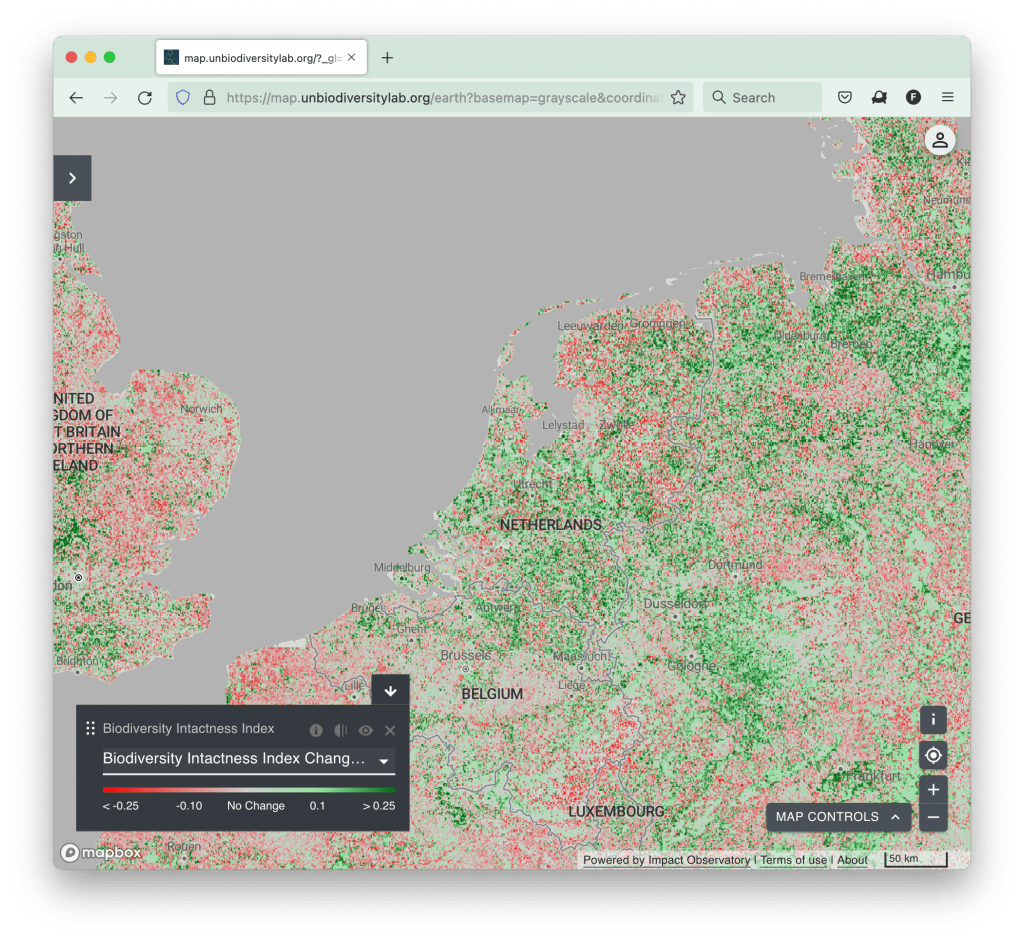
This is where the pretty visualizations come in, the infographics and the dash boards. Some of it is really impressive. The picture below comes from the UN Biodiversity Lab, and any one who shows up can access it. For free and anonymously ( try it ). You can see an overview of the world, and one can zoom in down to the level of a region, a country, a province, a city, a street and in some cases all the way down to the three pixels of my mom's garden.
Basically, what the visualizers help doing is exploring the data. It is something one can and should spend time on. Perhaps one gets to the famous 'hey that's funny' moment and makes a big discovery in the data.
Analyzing and sense making
Next, the 'so what?' question comes in. It is all very awe inspiring, but who cares that the three pixels about my mom's garden are blue? At the lowest level, the data means virtually nothing, where at the highest level of the world map, it is too much to take in. And in between?
The so-what question is where conceptually speaking, the matter of nature conservation data becomes very interesting. How does one make sense of it all? The easy answer is, this is what we have the analysts for, the researchers at government agencies, companies, NGOs, research institutes and universities. The difficult answer is, it depends. It depends on what one wants or needs to know. It depends on a question.
Whose question? Well, anybody's. Lots of the data and the visualizers are open access too, so anybody can use them to answer questions. For example, the high school student or scientist who is doing a project. Journalists may have questions that can be answered with help of the on-line databases. An example is the Oxpeckers Center for Investigative Environmental Journalism.
Another example is an NGO that wants to save the whales. Unfortunately, the whaler that wants to hunt them, can also use them. I just want to point it out here, because it is something to be aware about. Fortunately, database owners and administrators are aware. Just as with other technologies, there are ethical aspects to consider. It is outside the scope of this post, but they are not a minor nor a simple topic. People write entire books about this.
Knowledge products and policy making
Different groups of users process their questions, analysis and sense making into some form of 'knowledge products'. These are, simply put, their reports, which differ in style, format, medium and more. A journalist writes an article for a magazine or blog, a student may produce a thesis or an infographic, a scientist a scientific article, and so on. These knowledge products may then be somehow published and will probably start leading their own lives. They are being read by other people, who can discard them or use them for their own purposes, whether aligned with the intention of the authors or not.
There is one particular group of knowledge product users: policy makers. One can distinguish between two types of policy making : making new laws and regulations, and secondly, implementing laws and regulations. Both fall under the same heading, but the two have different needs.
The policy makers who implements a regulation or law has very specific needs for data and analysis, which depend on the task at hand. They could use not just the knowledge products, but also the available databases and tools. However, if but one variable is missing, then they would have to expend resources to capture the missing data. Probably, more than one variable is missing and the policy makers have to compile the needed data out of a number of different sources. So much so, that they may have specialized offices or agencies to do that.
The policy makers of the other type are lawmakers or regulation makers. They have a completely different need. They need 'knowledge products' with 'actionable results'. In other words, they need the data collected, visualized and analyzed for them, and then presented in a report with an executive summary which tells them what their options for law and regulation making are. They are not too interested in the nitty gritty details, as long as the data and analysis are deemed trustworthy. Lawmakers need a compelling argument, supported by data and analysis, which leads to clear conclusions to stimulate something and/or prohibit something else. They can then decide to follow the advice or not.
Concluding remarks
Let's start with a disclaimer : the world is far more complex than this overview and the graph at the beginning suggest. Not all data ends up in a database. A lot of data ends up in a text document with field notes, or ends up as a set of files on a hard disk. Similarly, not all data from databases ends up in repositories or aggregators. And not all policy reports are equally well based on data and analysis.
Another important caveat is that many more relations exist( i.e. arrows can be drawn ) between the elements. Field observations may directly end up in a knowledge product as anecdotal evidence or example. Feedback loops exist as well. Analysis may result in changes in the designs of databases, the data collected and the visualizations that are being created. In spite of these and other caveats, I believe most of the above is more or less what one may find in the world.
Having made the disclaimers, what can one take away from this overview?
First of all : when one encounters one of the elements in the chain, one should realize that there is a chain. A person's citizen science observation of a zebra during summer holidays, is not impressive on its own. However, it does add yet another observation to a collection in a database at some research institute. It may find its way into knowledge product, and eventually in a law or policy on national wildlife reserves. Another example is that, when one sees a 'nice picture' like the example from the UN Biodiversity Lab, one should realize that there is a whole system and great expenditure of resources behind it.
Secondly : Those elements that are part of a chain are far more valuable than the separate elements. Because of its part in the chain, every pixel of the 'nice picture' has some importance and meaning. A knowledge product that is not linked to analysis, aggregators, databases, and observations, is, in my view, far less valuable than when it does have these links. However, this does not mean that when it is connected it necessarily is of good quality and trustworthy.
Thirdly : it can not be stressed enough that the data, databases, aggregators, visualizations, analyses and knowledge products are all produced by not just a large amount of actors, but also by many different kinds of actors: scientists, citizen scientists, NGOs, sponsors, governments and their agencies, supranational organizations such as the UN, companies, journalists, and so on. They each have their own background, interests and ways of working. So, it is up to the users to make their own assessments regarding the quality and trustworthiness.
Acknowledgements
Thank you, Diego Juffe Bignoli for pointing me to the concept of 'knowledge product'. If there are any mistakes in my presentation of the concept, then those are all mine.
This post is also available at https://rubberbootsdata.com/2022/08/09/introduction-to-online-nature-conservation-databases-from-data-to-knowledge-product/
Data, databases and apps ( Claris FileMaker ) for nature conservation and sustainability research. Funding expertise as a bonus


Please sign in or register for FREE
If you are a registered user on WildHub, please sign in
Thank you so much for sharing this very insightful piece Frank. @Adam Barlow @Lena Plaud this piece may be of interest to you regarding databases!
@Lize Gibson-Hall Thanks !! Completely! Such a great work @Frank van der Most
this is a great post - very insightful. thanks for sharing @Frank van der Most ! From my perspectives the most important users of data are the conservationists that need such info to monitor, evaluate, and report on the impact of their work - to inform management decisions and communicate with stakeholders/partners
If you are interested in talking to me about this post, then meet me at the coffee corner, around 9.15 or 15.15 CST